


Hello everyone! My name is Jacob and this is my first ML project that I'm doing on my own. It's also my first blog post, hope you will like it.
This project comes from Kaggle's competition "Titanic - Machine Learning from Disaster". Here is the link to the competition: https://www.kaggle.com/competitions/titanic/data
The goal is to predict whether a passenger on the Titanic is going to survive or not. The required evaluation metric is accuracy and that's how I will be scoring my model.
My full notebook with a solution can be found on:
my Kaggle profile: https://www.kaggle.com/jakubkuliski/code
my GitHub repository: https://github.com/kulaBula/Small-ML-Projects/tree/main/Titanic%20Project
I started by setting up a project in Jupyter Notebook and importing all the tools I would need. Then I imported all the data from Kaggle's competition page and started analyzing it. I found out that there are a few columns with non-numerical values.
PassengerId      int64
Survived         int64
Pclass           int64
Name            object
Sex             object
Age            float64
SibSp            int64
Parch            int64
Ticket          object
Fare           float64
Cabin           object
Embarked        object
dtype: object
I knew I would have to transform all the data into numerical values at least two times (for training and test datasets), so I created a function that:
Removes all rows with missing target values (
"Survived")OneHotEncodes some of the values
Changes back column names (I will explain this in a second)
Removes all the unnecessary columns
I've decided that the columns "Name", "Ticket" and "Cabin" should be removed because these were all unique non-numerical values. OneHotEncoding them would change my DataFrame into complete chaos and I had simply no other idea what to do with these columns.
This is the final version of the data-transforming function:
def get_df_ready(df, isTestSet=False):
    # Remove all the missing values from Survived column if the dataFrame is not a test set
    if(isTestSet==False):
        df.dropna(subset=["Survived"], inplace=True)

    # Remove the Name and Ticket column
    df = df.drop("Ticket", axis=1)
    df = df.drop("Name", axis=1)
    df = df.drop("Cabin", axis=1)

    # Fill the missing values
    df["Age"].fillna(df["Age"].median(), inplace=True)
    #df["Cabin"].fillna("unknown", inplace=True)
    df["Embarked"].fillna("unknown", inplace=True)

    # Encode Sex and Embarked
    categorical_features = ["Sex", "Embarked"]
    one_hot = OneHotEncoder()
    transformer = ColumnTransformer([("one_hot",
                                 one_hot,
                                 categorical_features)],
                                 remainder="passthrough")
    # Trasform
    ready_df = transformer.fit_transform(df)
    # Change to a df and restore column names (they will be changed a bit because of one hot encoder)
    transformed_df = pd.DataFrame(ready_df, columns=transformer.get_feature_names_out())
    return transformed_df
After OneHotEncoding the data I noticed that my column names were changed to just numbers and I wanted to change that. After exhaustive research, I came across this article: https://datagy.io/sklearn-one-hot-encode/ which had the answer I was looking for. This function: transformer.get_feature_names_out() returns a list of column names as they were before applying the transformer function. We will use this function to sort of restore the previous names of our columns, although modified. I think that these are still better than plain numbers.
Next, I split the data into train and test sets using train_test_split() function.
My data was finally ready. Maybe not in the most esthetic form, but it was ready. During my research in this project, I found that there is something called data standardization and that it could potentially improve my model's performance, but I had and still have no clue what that means and that's something I would like to research.
Then it was time to pick a model. After some digging on the SciKit Learn website, I decided to try the following:
LinearSVC
SVC
KNN
LogisticRegression
RandomForestClassifier
AdaBoost
I have heard about the majority of them, except AdaBoost which is new to me and that's exactly why I have decided to include it as well.
We have 6 models and fitting and scoring them individually seemed like a lot of excess work, so I decided to create a function that will fit, score the model and append the result to a dictionary. This will allow us to compare our models later on.
This is what the code for this function looks like:
def fit_and_score(model_dictionary):
    """
    This function takes as an input a dictionary of models, fits and scoress all of the models using accuracy.
    """
    # Set random seed
    np.random.seed(42)

    # Create an empty results dictionary
    results = {}

    for name, model in model_dictionary.items():
        # Fit the model
        model.fit(X_train, y_train)
        # Score the model using accuracy and add the results
        results[name] = cross_val_score(model, X_test, y_test, cv=5, scoring="accuracy").mean()
    # Return the results dictionary
    return results
My results were the following:
'LinearSVC': 0.6538095238095238,
 'SVC': 0.5977777777777779,
 'KNN': 0.5638095238095239,
 'LogisticRegression': 0.6984126984126984,
 'RandomForestClassifier': 0.7266666666666668,
 'AdaBoostClassifier': 0.6252380952380953
I was not happy with most of them, so I created GridSearchCV for each one of them and collected their scores into a dictionary called updated_models_scores. Here are the grid searches I made:
%%time
updated_models_scores = {}

# GridSearchCV for SVC
svc_grid = {"C": (0.1, 1, 10, 100, 1000),
            "gamma": (0.1, 1, 10, 100),
            "kernel": ("linear", "rbf", "poly")}

# Setup GridSearchCV for SVC
gs_svc = GridSearchCV(SVC(),
                      param_grid=svc_grid,
                      cv=5,
                      verbose=True)
gs_svc.fit(X_train, y_train)
# Add the score to the dictionary
updated_models_scores["SVC"] = gs_svc.score(X_test, y_test)

# Setup GridSearchCV for LogisticRegression
logistic_regression_grid = {"C": (0.1, 1, 10, 100, 1000),
                            "max_iter": np.arange(100,1000,100)}
gs_logistic_regression = GridSearchCV(LogisticRegression(n_jobs=-1),
                                      param_grid=logistic_regression_grid,
                                      cv=5,
                                      verbose=True)
gs_logistic_regression.fit(X_train, y_train);
# Add the score to the dictionary
updated_models_scores["LogisticRegression"] = gs_logistic_regression.score(X_test, y_test)

# Setup GridSearchCV for LinearnSVC
linear_svc_grid = {"C": (0.1, 1, 10, 100, 1000)}
gs_linear_svc = GridSearchCV(LinearSVC(),
                             param_grid=linear_svc_grid,
                             cv=5,
                             verbose=True,
                             n_jobs=-1)
gs_linear_svc.fit(X_train, y_train)
# Add the score to the dictionary
updated_models_scores["LinearSVC"] = gs_linear_svc.score(X_test, y_test)

# Setup GridSearchCV for RandomForestClassifier
random_forest_clf_grid = {"n_estimators": np.arange(100, 2000, 100),
                          "max_depth": (5, 8, 15, 25, 30),
                          "min_samples_split": (2, 5, 10, 15, 100),
                          "min_samples_leaf": (1, 2, 5, 10)}
gs_random_forest_clf = GridSearchCV(RandomForestClassifier(n_jobs=-1),
                                    param_grid=random_forest_clf_grid,
                                    cv=5,
                                    verbose=True,
                                    n_jobs=-1)
gs_random_forest_clf.fit(X_train, y_train)
# Add the score to the dictionary
updated_models_scores["RandomForestClassifier"] = gs_random_forest_clf.score(X_test, y_test)

# Setup GridSearchCV for AdaBoostClassiffier
ada_boost_clf_grid = {"n_estimators": (10, 50, 100, 500, 1000, 5000),
                      "learning_rate": np.arange(0.1, 2.1, 0.1)}
gs_ada_boost_clf = GridSearchCV(AdaBoostClassifier(),
                                param_grid=ada_boost_clf_grid,
                                cv=5,
                                verbose=True,
                                n_jobs=-1)
gs_ada_boost_clf.fit(X_train, y_train)
# Add the score to the dictionary
updated_models_scores["AdaBoostClassifier"] = gs_ada_boost_clf.score(X_test, y_test)
The results were the following:
'LogisticRegression': 0.8324022346368715,
 'LinearSVC': 0.8156424581005587,
 'RandomForestClassifier': 0.9329608938547486,
 'AdaBoostClassifier': 0.8324022346368715
Important note: the SVC GridSearchCV takes forever to run (at least a day for me) and I'm not sure if that's because of a mistake from my side or it just runs for that long.
Then I created a data frame out of my two dictionaries to compare the scores. I created a plot, added some details, and here is the final result:
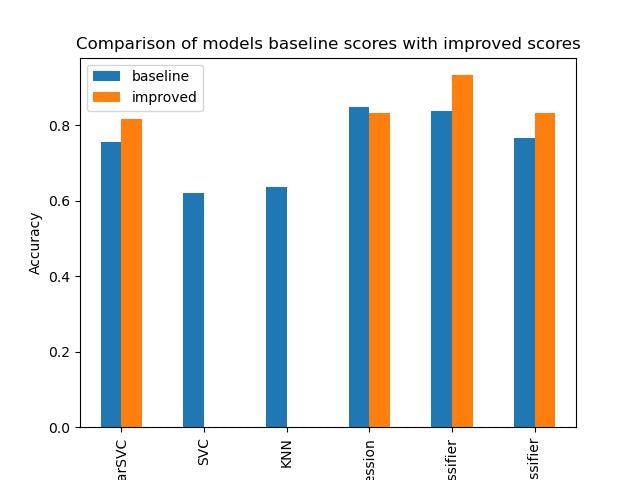
While computing these results I have found, that some models cannot make use of the n_jobs parameter, because they don't have one. Fortunately GridSearchCV itself can use n_jobs, so even if you are grid-searching with a model, that cannot use n_jobs you still can if you apply the n_jobs as an argument for GridSearchCV and make your computing faster. This is a very useful lesson for the future, although I'm still wondering why some models can use job parallelization and some cannot.
Then I had everything done and set up and I was ready to make some predictions. I had to overcome some issues, but after a while, I was finally able to make predictions and upload them to Kaggle. Here is what the code looks like:
# Make predictions
predictions = loaded_random_forest_clf.predict(transformed_test_df)
predictions_df = pd.DataFrame(columns=("PassengerId", "Survived")
# Adding all the values in the form of integers
predictions_df["PassengerId"] = transformed_test_df["remainder__PassengerId"].astype(int)
predictions_df["Survived"] = predictions.astype(int)
# Setup the index of the dataFrame as PassengerId so that our dataFrame has a required shape
predictions_df.set_index("PassengerId", inplace=True)
I reached a 43% accuracy, which is a lot less than I have expected because the accuracy on the training data was about 92%, so I was hoping for at least 76% on the test data.
After a couple of minutes, I realized where this huge gap in accuracy score may come from. When transforming the test data I had to add a column for an unknown embark location and that column was added at the back of the data frame, not in the middle as it was in the training data. I moved the column to its right location.
Here is how I fixed it:
# Check if there are any missing values
transformed_test_df.isna().sum()

# Fill in the missing data
# Filling in missing Fare values with the column's median value
transformed_test_df.remainder__Fare.fillna(value=transformed_test_df.remainder__Fare.median(), inplace=True)
# Adding that one missing column and setting all the values to 0, because there were no NaNs in the Embarked column
transformed_test_df["one_hot__Embarked_unknown"] = 0

# Reorder the dataFrame as the original, training one
transformed_test_df = transformed_test_df[["one_hot__Sex_female", "one_hot__Sex_male", "one_hot__Embarked_C", "one_hot__Embarked_Q", "one_hot__Embarked_S","one_hot__Embarked_unknown","remainder__PassengerId","remainder__Pclass","remainder__Age","remainder__SibSp","remainder__Parch","remainder__Fare"]]
Then I redid the predictions and had to prepare the data for submission. I submitted my answers again and this time I scored 76%!!!
I am way more happy with this score and I think my result is quite satisfying, especially considering that this is my first-ever project. One day I will revisit this project and see if I can achieve an even better score.
Thank You for reading and have a nice day!
The picture of the RMS Titanic at the top of the page is by Francis Godolphin Osbourne Stuart - http://www.uwants.com/viewthread.php?tid=3817223&extra=page%3D1, Public Domain, https://commons.wikimedia.org/w/index.php?curid=2990792